
See what you actually paid for.
Your utility bills some hours and not others. Explore splits your Powerwall history the way your bill does: paid hours and free hours, each rate period, and your own peak windows. It also shows where your home's power came from.
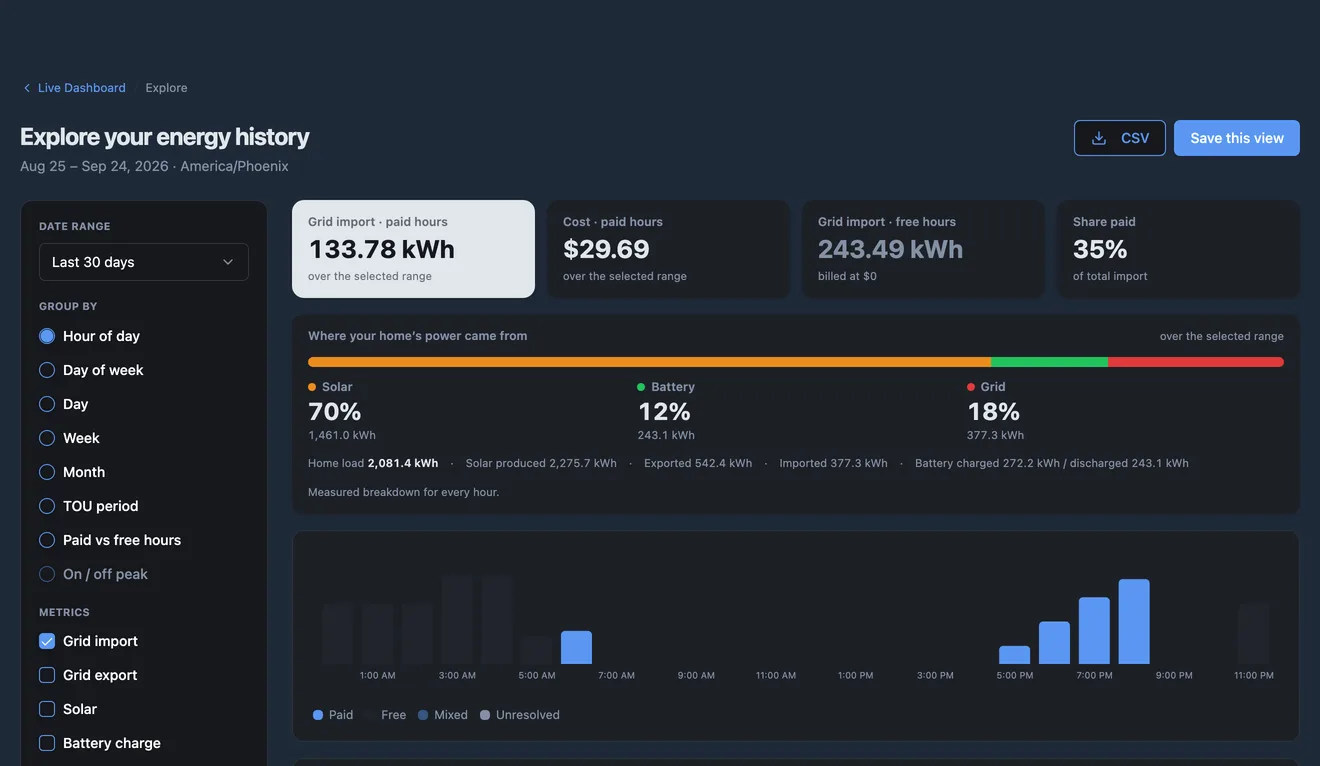
Paid hours and free hours, kept apart
A raw total counts the free-nights kilowatt-hours alongside the 5 pm ones. Explore prices every hour at your plan's rate for that hour, then totals the paid hours and the free hours separately.
- Grid import and cost for paid hours only
- Free-hour import and share paid, shown when your range has $0 hours in it
- Hours it can't price are labelled as unpriced, not counted as free
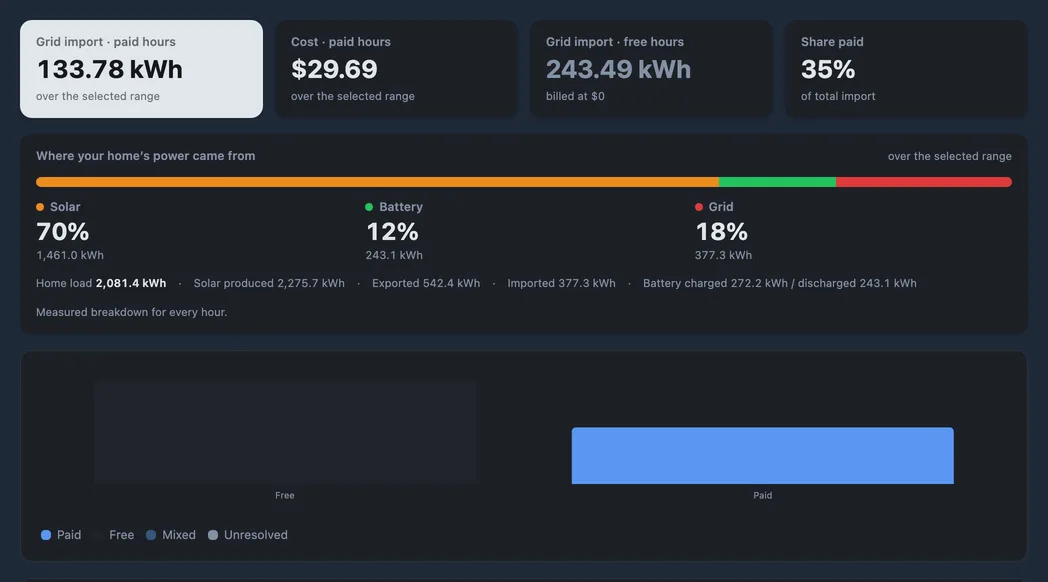
Solar, battery, grid, as a share of your home's load
A single card breaks your home's consumption down by source, for example 70% solar, 12% battery, 18% grid, with kilowatt-hours next to each. Under it you get the range's totals for home load, solar, export, import and battery.
Each card says whether its numbers were measured or estimated.

Build the view you want
The date range is the only control that fetches new data. Every other control regroups what's already loaded, so changes show up immediately.
Group by time or by rate
Hour of day, day of week, day, week, month, rate period, paid vs free hours, or on and off peak.
Split by your own peak windows
Group by the hours your Peak Time and DemandGuard automations run, and see what you imported while they were working.
History from before you joined
Pick a range from before you signed up and Grid Getter fetches those hours from Tesla, then keeps them.
Pick your metric
Grid import and export, solar, battery, home load, state of charge, charging from solar vs grid, and grid outages. Show them as bars or a line.
Save and share views
Save up to 25 views per site. The URL holds the whole view, so a bookmark brings it back exactly as it was.
Table and CSV
Every group in a table with paid and free kWh, rate and cost. Download it as CSV for your own spreadsheet.
Start with the free tab
On your dashboard: the last 7 days, paid vs free hours or by rate period, plus where your power came from.
Custom ranges, every grouping and metric, saved views and CSV export. Free accounts get a read-only preview covering 90 days.
About Explore
Is Explore free?
The Explore tab on the dashboard is free on every plan and covers your last 7 days. The full data builder, with custom ranges, saved views and CSV export, is part of Premium. Free accounts can open the builder as a read-only preview covering the last 90 days.
Can I see history from before I signed up?
Yes. When you pick a range Grid Getter hasn't recorded, it fetches the missing hours from Tesla, which has been keeping your Powerwall's history since it was installed. Those hours are saved, so the range loads straight away next time.
Why do some hours show $0?
If your plan has a free window, such as free nights, those hours bill at $0 and are counted as free. Explore works this out from your actual rate for each hour, not a fixed clock window, so it stays right if your plan changes.
Is Explore on the mobile apps?
Not yet. Explore is in the web app at app.gridgetter.com, and it works in a phone browser.
Find out where your bill comes from
Connect your Powerwall for free. The Explore tab is on your dashboard from the first day.